
Economy & Development
Economy of Himachal Pradesh
Understand the size, structure and direction of Himachal Pradesh’s economy—from agriculture and horticulture to manufacturing, tourism, services and hydropower.
Last reviewed: 1 September 2026 • FY 2025–26 Advance Estimates • Official Government sources
₹2,53,886 cr
GSDP at current prices
8.3%
Real GSDP growth
₹2,83,626
Per-capita income
46.3%
Services share of GSVA
FY 2025–26
Advance Estimates
Overview · Snapshot · Structure · Major sectors · Development · Challenges · Resources · FAQs
A mountain economy in transition
Understanding Himachal Pradesh’s Economy
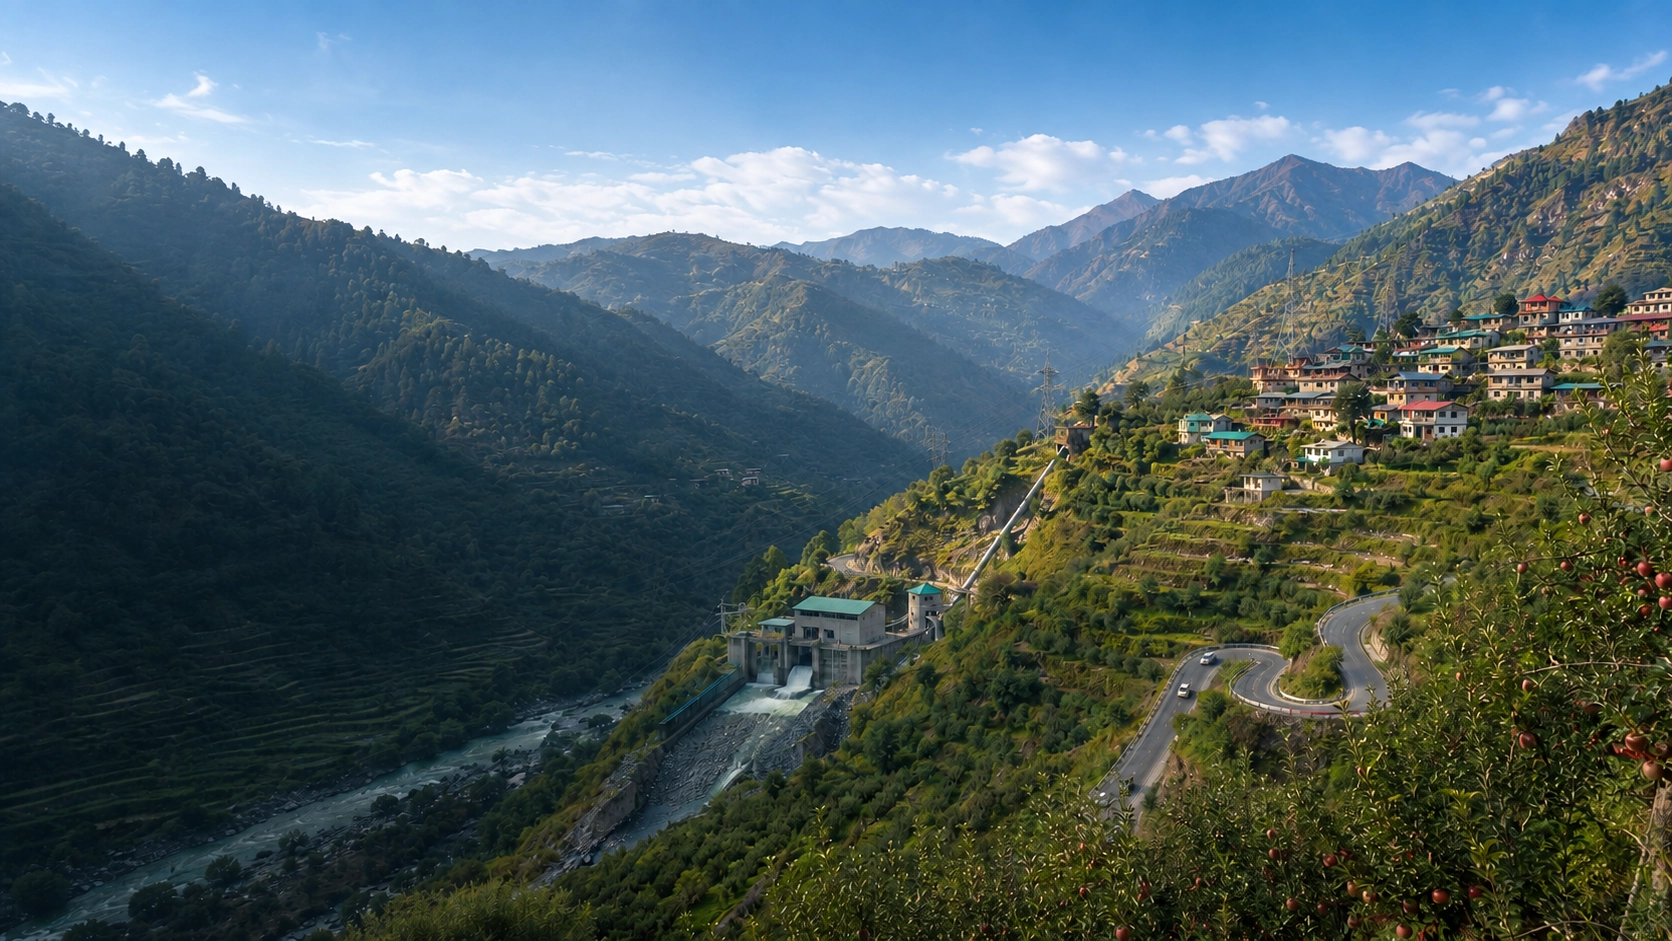
Himachal Pradesh has a diverse mountain economy shaped by difficult terrain, dispersed settlements, natural resources and close links between rural livelihoods and public infrastructure.
Agriculture and horticulture remain central to household income across large parts of the State, while manufacturing, construction, trade, transport, tourism, public services and hydropower account for most measured economic output.
The economy has gradually shifted towards services and industry. However, a large share of the workforce still depends on the primary sector even though it contributes a much smaller share of Gross State Value Added.
Use this hub to examine verified indicators, understand the major sectors and move into detailed HimState resources on the industries and livelihoods that shape the State.
Use this hub to
- Read current State-level indicators.
- Understand the three-sector economy.
- Explore planned sector hubs.
- Open official surveys and datasets.
- Find connected HimState articles.
Latest verified indicators
Economic Snapshot
The following figures are Advance Estimates for FY 2025–26 unless another reference year is stated.
Nominal economy
₹2,53,886 cr
GSDP at current prices, with estimated nominal growth of 10.1%.
Real economy
₹1,56,681 cr
GSDP at constant 2011–12 prices, with estimated real growth of 8.3%.
Value added
₹2,36,137 cr
Gross State Value Added across the primary, secondary and tertiary sectors.
Income
₹2,83,626
Per-capita income at current prices, estimated to have grown 9.8%.
AE: Advance Estimate. These official estimates may be revised in later statistical releases.
Composition of GSVA
Share at current prices · FY 2025–26 Advance Estimates
Services 46.3%
Secondary 39.4%
14.3%
Read the indicators carefully: GSDP measures the State economy at market prices, GSVA measures value added by producing sectors, and per-capita income is an average. They are related but not interchangeable.
How output is organised
Structure of the Economy
Services lead measured output, followed by the secondary sector. The primary sector has the smallest output share but remains crucial to rural livelihoods.
14.3% of GSVA
Primary Sector
Agriculture, horticulture, livestock, forestry, fishing, mining and quarrying form the primary sector.
Its output share is relatively small, but it supports around 53.9% of the workforce.
39.4% of GSVA
Secondary Sector
Manufacturing, electricity and utilities, and construction form the secondary sector.
Industrial clusters, pharmaceuticals, food processing, construction and energy infrastructure are important components.
46.3% of GSVA
Tertiary Sector
Trade, hotels, transport, banking, real estate, public administration and other services form the tertiary sector.
Tourism is visible, but transport, retail, finance, education, health and public services also shape output.
Economy knowledge directory
Explore the Major Economic Sectors
These planned gateways will connect this overview with dedicated sector hubs, datasets and detailed entries.
01 · Planned hub
Agriculture & Rural Economy
Farming systems, crops, livestock, fisheries, natural farming, irrigation, rural markets and livelihoods.
02 · Planned hub
Horticulture & Fruit Economy
Apples and other fruits, nurseries, packhouses, cold chains, markets, climate risk and household income.
03 · Planned hub
Tourism Economy
Accommodation, transport, food services, pilgrimage, adventure travel, visitor patterns and infrastructure.
04 · Planned hub
Industry & Manufacturing
Industrial areas, pharmaceuticals, food processing, clusters, construction, policy and investment.
05 · Planned hub
Energy & Hydropower
Hydropower, electricity, State entitlements, environmental questions and renewable-energy initiatives.
06 · Planned hub
Infrastructure & Connectivity
Roads, tunnels, railways, airports, digital networks, logistics and urban infrastructure.
07 · Planned hub
Employment & Livelihoods
Jobs, migration, skills, labour participation, self-employment and rural livelihoods.
08 · Planned hub
Public Finance & State Budget
Revenue, expenditure, debt, fiscal indicators, annual budgets and development priorities.
09 · Planned hub
Investment, MSMEs & Start-ups
Entrepreneurship, small enterprises, investment policy, incentives and self-employment programmes.
10 · Planned directory
District Economies
Compare agriculture, industry, tourism, services, connectivity and specialisation across districts.
Beyond the headline numbers
Growth, Employment & Development
Growth describes overall output. It does not show how income, opportunity and risk are distributed across households, sectors and districts.
Growth is uneven
Real GSDP growth of 8.3% indicates strong expansion, but growth may be concentrated in sectors or locations employing fewer people.
The output–employment gap
The primary sector supports a far larger workforce share than output share. Market access and risk management influence rural income.
Connectivity is an input
Road closures, long travel times and difficult last-mile transport raise costs across major sectors and public services.
Hydropower and revenue
The Survey records 1,145 MW commissioned during April–December 2025 and 1,574.06 MW of saleable State entitlement across 143 projects.
Tourism context: The Economic Survey reports 311.47 lakh total arrivals in 2025. Arrival counts should not be treated as a direct measure of tourism income.
Constraints and possible directions
Challenges & Emerging Opportunities
The State’s economic strengths are closely connected to its environmental and geographical constraints.
Key Challenges
- Mountain logistics: higher infrastructure and transport costs.
- Climate exposure: weather extremes affect crops, roads, tourism and energy.
- Low productivity: many workers depend on a smaller-output primary sector.
- Uneven development: opportunity differs sharply by location.
- Seasonality: farm and tourism income is concentrated in short periods.
- Employment constraints: local opportunities may not match youth aspirations.
- Fiscal pressure: mountain services are expensive to maintain.
Emerging Opportunities
- Value-added horticulture, processing and cold chains.
- Year-round rural, cultural, wellness and nature-based tourism.
- Pharmaceuticals and specialised manufacturing.
- Renewable-energy diversification and storage.
- Digital services and technology-enabled small businesses.
- Climate-resilient infrastructure and agriculture.
- Local enterprises linked to crafts, food and logistics.
- Better district-level data for planning and accountability.
Primary sources
Official Reports & Economic Data
Use these Government sources for State indicators, sector statistics, budget information and development resources.
Economic Survey 2025–26
State performance, sector trends, finance and Advance Estimates.
Statistical Publications
Year Book, district indicators, data visualisations and publications.
Planning Department
Development planning, sustainability resources and selected reports.
Quick answers
Frequently Asked Questions
What is the GSDP of Himachal Pradesh?
GSDP at current prices is estimated at ₹2,53,886 crore for FY 2025–26, according to Advance Estimates.
What is the economic growth rate?
Real GSDP growth is estimated at 8.3% for FY 2025–26; nominal growth is estimated at 10.1%.
What is the per-capita income?
Per-capita income at current prices is estimated at ₹2,83,626 for FY 2025–26.
Which is the largest sector?
The tertiary or services sector is largest, accounting for an estimated 46.3% of GSVA in FY 2025–26.
Why are agriculture and horticulture important?
The primary sector supports a much larger workforce share than its contribution to GSVA and remains vital for rural income and district economies.
What are the main industries?
Important activities include pharmaceuticals, manufacturing, food processing, construction, utilities, tourism services, horticulture and agriculture.
How important is tourism?
Tourism supports accommodation, transport, food services, retail and employment. Visitor counts should not be treated as a direct measure of income.
Where can official economic data be found?
The Department of Economic & Statistics publishes the Economic Survey, Statistical Year Book and datasets. The Finance Department publishes fiscal documents.
Continue Exploring Himachal Pradesh
The economy connects landscapes, livelihoods, infrastructure, enterprises and public institutions. Continue through HimState’s subject and district hubs.
Primary reference: Economic Survey 2025–26, Department of Economic & Statistics, Government of Himachal Pradesh · Last reviewed 1 September 2026